Related information
 A-Probe Guide
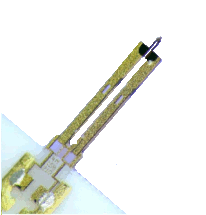
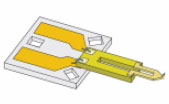
What is A-Probe?
How it works?
What can be done?
 Technical Guide
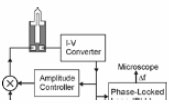
Electrical setup
Amplifier, Settings
Operations

The figure shows a typical approach curve of Akiyama-Probe. The dashed line “A” indicates the critical point where the tip starts periodic contact on the sample surface. Beyond this point, the resonance frequency increases linearly as the tip is moved closer to the sample surface in the periodic contact region. Oscillation amplitude of the tip decreases linearly and the center of the vibration is shifted in this region (see illustration at the bottom of the figure).
The end of the periodic contact region is indicated by the dashed line “B”. Beyond this point, the probe works in a “quasi” contact mode, i.e., the tip remains in contact with the surface during the full oscillation cycle, whereas the cantilever is still vibrated by the TF.
The maximum frequency shift obtained in the periodic contact region (denoted as Δf) is a specific and constant value for each probe. The distance ΔZ is about a half peak-to-peak amplitude of tip oscillation in free space.